The closing price for ZNGA matches its 200-day moving average, indicating a long-term lateral trend.
Trend for ZNGA as of Thursday September 12th, 2013
Long-term: Lat
Intermediate: Down
Short-Term: Up
Chart for ZNGA
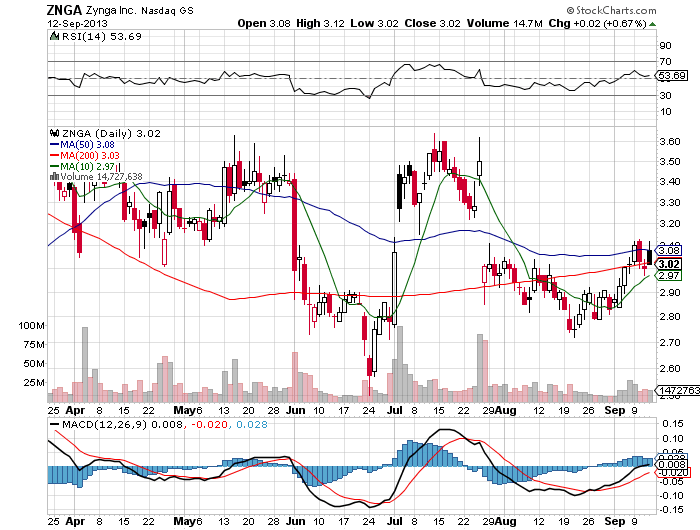
This post was generated by our Market Trends tool. The trends are simply based on the 10, 50, and 200-day moving averages. View the current market trends or analyze your own stocks.